PriceFusion™ Position Average Price Calculator (with Cost Analysis)
PriceFusion™ is a professional-grade Position Average Price Calculator designed for traders who scale into or out of positions. Whether you’re dollar-cost averaging into crypto, pyramiding into forex, or adjusting exposure in stocks, PriceFusion™ ensures you know your true average entry price, including commissions and fees.
This tool reflects how trading firms, hedge funds, and serious market participants calculate cost basis before risk decisions.
PriceFusion™ Position Average Price Calculator
Transaction History
Date | Symbol | Type | Lots | Price | Currency | Comm. | Actions |
---|
No transactions added yet.
Results
Calculating, please wait…
Position Summary
The position summary provides a high-level snapshot of your calculated EUR/USD position based on the entered trades. Key metrics like Position Status and Net Lots show your current market exposure resulting from averaging entries. The Average Price (Buy or Sell) indicates your overall entry point for the open position.
Guidance loading…
Detailed Breakdown
Dive deeper into your position. The tabs below separate your overall summary, buy-side metrics, sell-side metrics, and total costs for a comprehensive analysis.
This tab shows the overall calculation summary and key metrics for your position.
This tab shows detailed metrics and analysis for all buy trades in your position.
This tab shows detailed metrics and analysis for all sell trades in your position.
This tab shows a breakdown of all costs and fees associated with your trades.
Overall Summary Details
Metric | Value |
---|---|
Calculation required. |
Buy Side Analysis
Metric | Value |
---|---|
No buy trades or calculation required. |
Sell Side Analysis
Metric | Value |
---|---|
No sell trades or calculation required. |
Cost Breakdown
Metric | Value |
---|---|
Calculation required. |
Interpretation loading…
Guidance loading…
Average Price Chart
Run calculation to view chart.
How to Read the Chart
This chart visualizes your entered trades relative to the calculated average price(s):
- Buy Trades: Shown as teal triangles. Hover for details (Price, Lots, Date).
- Sell Trades: Shown as orange diamonds. Hover for details.
- Marker Size: Indicates the relative volume (Lots) of the trade. Larger markers represent larger trades.
- Avg Buy Price: Dashed teal line shows the weighted average entry price for all Buys. Hover line for value.
- Avg Sell Price: Dashed orange line shows the weighted average entry price for all Sells. Hover line for value.
- X-axis: Represents the order in which trades were entered (Trade Number).
- Y-axis: Represents the Price of each trade.
Compare individual trade points to the relevant average line to see how each trade influenced the overall average. Larger markers have a greater influence.
Hover over points or lines to see detailed values for each trade.
Interpretation loading…
Guidance loading…
Information
Modal content will appear here.
Notification
Loading information…
Confirm Deletion
Are you sure you want to delete this entry?
How to Use PriceFusion™ for Accurate Average Price
PriceFusion™ is built for traders who combine multiple trades into one position. Instead of guessing, it gives you the weighted average entry price, the real number professionals rely on for risk and profit assessment.
- Add Trades: Enter asset, transaction type (Buy/Sell), quantity, price, and fees.
- Track History: Each trade is stored in the transaction table with editable details.
- Calculate Average: Click Calculate once two or more trades are added.
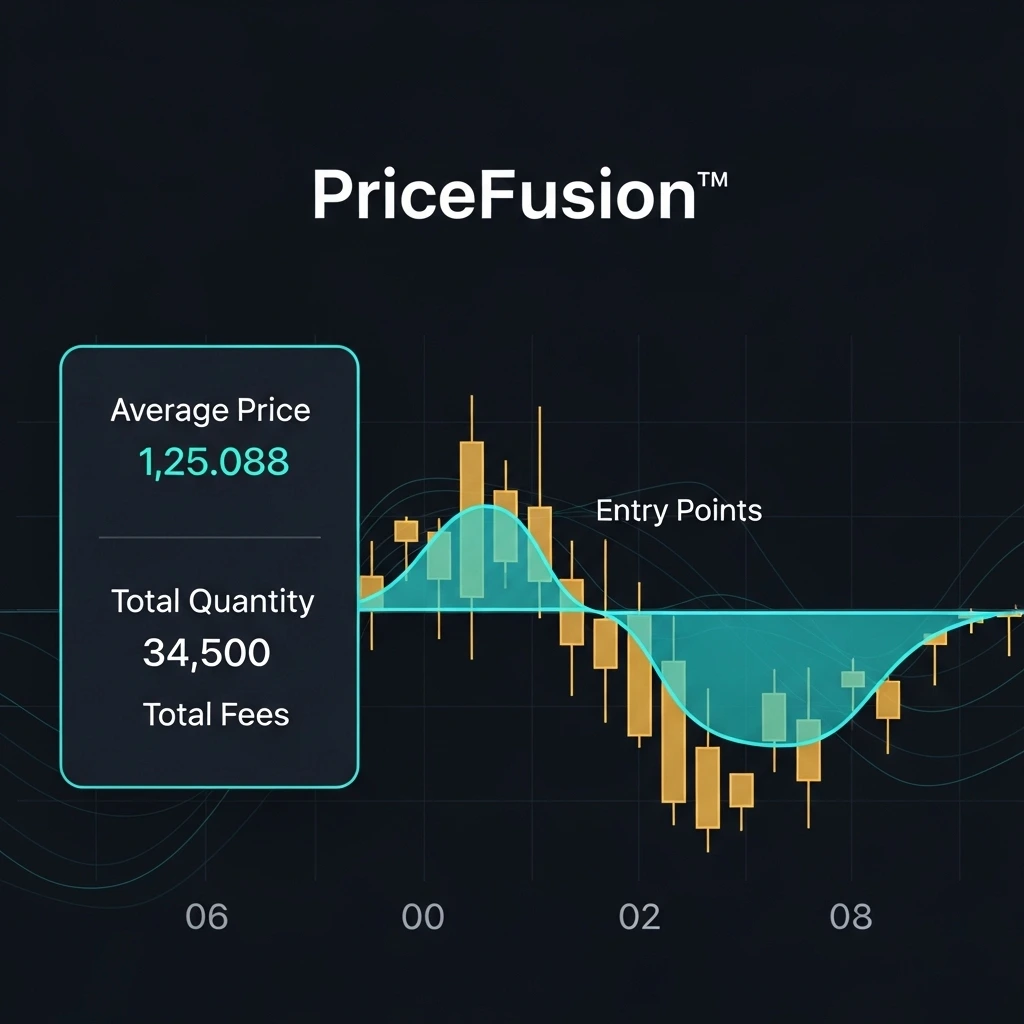
- Visualize: See your entry points, average line, and current price plotted on a chart.
Why Average Price Matters in Trading
Institutions never treat trades in isolation. They calculate the weighted average price of all entries to decide position value, margin requirements, and profit targets. Regulators like SEC and FINRA highlight cost-basis accuracy as critical for compliance and reporting.
The Math Behind PriceFusion™
The calculator uses a weighted formula:
Average Price = Σ(Trade Price × Quantity) ÷ Σ(Quantity)
- Weighted: Larger trades have more influence on the final average.
- Fees Included: Commission and transaction costs adjust the effective price.
Example: Averaging Into a Crypto Position
Sophia buys BTC in three steps:
- Trade 1: 0.5 BTC at $30,000
- Trade 2: 0.3 BTC at $28,000
- Trade 3: 0.2 BTC at $32,000
Total quantity = 1.0 BTC. PriceFusion™ calculates:
- Weighted average entry = $29,400
- Including $50 in fees, net average entry = $29,450
This is Sophia’s true cost basis, the figure she must beat to be in profit.
Position Average Price Calculator FAQs
Can PriceFusion™ handle both Buy and Sell trades?
Yes. It calculates average price for net long or net short positions.
Does it include transaction fees?
Absolutely. Commissions and fees are factored into your average price.
Can I edit or remove trades?
Yes. The transaction table allows full editing or deleting of trades before recalculating.
Does this work for crypto and stocks?
Yes. PriceFusion™ supports forex, stocks, indices, commodities, and crypto pairs.
Why not just use last trade price?
Because averaging multiple trades gives you the real cost basis, not a misleading snapshot.
Can PriceFusion™ help with tax reporting?
Yes. Many traders use average price to report accurate cost basis for capital gains calculations.

Join the Discussion
How do you manage averaging into trades? Do you use weighted cost or simple average? Share your strategy below.