


 created by
 Adrian Volkov
 reviewed by
Jaron Bancroft


How to Use DrawMax™ for Strategic Risk Analysis
DrawMax™ is more than a basic drawdown calculator. It's your post-loss navigation tool. Designed with real traders and risk managers in mind, it operates in two precision modes:
- Choose Your Mode: Use Drawdown to assess a peak-to-trough loss, or Recovery to calculate the gain required to return to breakeven.
- Select Calculation Type: Enter values by dollar amount or percentage. Toggle between realistic loss amounts or hypothetical decline percentages.
- Input Account Data: Provide Account High, Low, Current Equity, or Recovery Target depending on the selected mode.
- Click Calculate: Instantly see the drawdown percentage and the required recovery gain. The results are accurate, institutional-style metrics used by professional risk desks.
Why Drawdowns Matter (And Why Most Traders Ignore Them)
Drawdowns aren’t just losses! They’re psychological tipping points. A 25% drawdown requires a 33% gain to recover. A 50% drawdown? You’ll need to double your money to breakeven. These aren’t just numbers; they’re stress tests for your system and your discipline.
Both FCA and ESMA regularly warn retail investors about unmanaged risk and emotional decision-making. DrawMax™ is built to eliminate that blind spot with brutal, unfiltered clarity.
The Math Behind Drawdowns & Recovery
These are the same formulas used by hedge funds and institutional risk officers:
Max Drawdown % = ((High - Low) / High) * 100
Recovery Gain % = ((High - Low) / Low) * 100
- Drawdown %: What percentage you’ve lost from your peak equity.
- Recovery %: The percentage gain needed from your lowest point to reach your original peak.
These metrics are vital when calculating position size adjustments, system shutdown thresholds, and performance stress tests.
Example: What It Takes to Bounce Back
Sarah built her trading account from $10,000 to $15,000, but after poor trades, it dropped to $9,000. She enters these values into DrawMax™:
- Account High: $15,000
- Account Low: $9,000
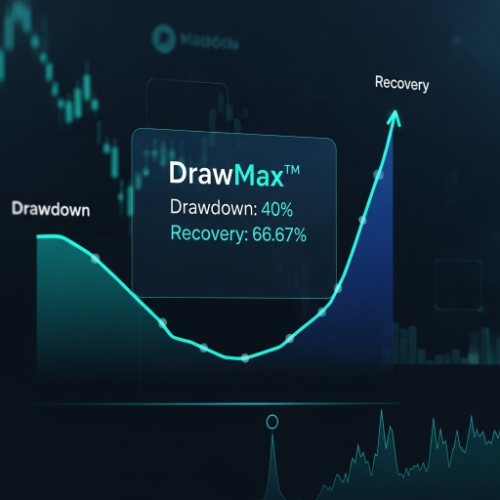
The Result: Her drawdown is 40%. But the real wake-up call? She needs a 66.67% return just to get back to $15,000. That’s the unspoken cost of poor risk control, and the power of recovery planning.
FAQs: Mastering the Numbers
What does DrawMax™ show me that other tools miss?
Most calculators only give you raw percentages. DrawMax™ shows you both damage and recovery required. It's a bidirectional, risk-informed analysis tool that mirrors what pro traders use to adjust exposure and system leverage.
What’s the difference between Max Drawdown and Absolute Drawdown?
Max Drawdown is measured from peak equity. Absolute Drawdown is measured from starting balance. The former shows volatility; the latter shows capital risk.
How do institutions use drawdown data?
Funds and prop firms track drawdowns to determine strategy failure points, define stop-trading rules, and calculate risk-adjusted returns like the MAR ratio.
What’s a healthy drawdown limit?
Professional systems rarely exceed 15% without review. If you're consistently seeing drawdowns over 30%, it's a signal to adjust position sizing or risk parameters immediately.
Can I use this tool for crypto, forex, or stocks?
Absolutely. Whether it’s ETH, GBP/USD, or NASDAQ stocks, percentage-based drawdown math remains universal. Currency selection is cosmetic, the logic applies to any traded asset class.
Why is the recovery gain always higher than the drawdown?
Because you're climbing from a smaller base. A 50% drawdown requires a 100% gain. This asymmetry is the reason smart risk managers cut losses early and protect peak equity.
Join the Discussion
How do you track drawdown and recovery in your trading? Have you adjusted your strategy based on these numbers? Drop your insight below. Real lessons make better traders.